>> Download a printable pdf of this datasheet

The Challenge:
Persuading stakeholders, communicating with the public, and convincing the court involve wrestling with complex technical concepts and vast amounts of data.
Intuitive visualization can clarify technical explanations and illustrate actual events or a proposed remedy in a way that the audience can understand.
NewFields has created powerful ways to communicate and present information by combining science with art. Our scientists, engineers, and physicians work closely with graphic artists to distill complex data and factual documents into compelling and informative visualizations. We customize solutions to meet the unique challenges that our clients face. Our services include:
- 3 and 4D Simulations
- Interactive Reporting and Analysis Tools
- Scientific Demonstratives & Illustration
- Animation & Video
- Communication Briefs

How We Can Help
NewFields is known for customizing solutions to meet the unique challenges that our clients face. We know that most projects do not fit neatly in a box. Below are some of the most common services we provide for communication and visualization services.
- 3D and 4D simulations
3D modeling creates a realistic representation of current and future site conditions while increasing stakeholder understanding of high-level technical problems.
3D modeling can be applied across several areas with versatile delivery formats, including:- Stratigraphic & Topographic Analysis
- Design & Engineering
- Contaminant Distribution
- Hydrogeologic Analyses
- Data Collection
- Scientific Demonstratives and Illustrations
Using graphics and illustrations to communicate highly complex technical data or information in a visual format makes it easier for clients, juries, and other audiences to comprehend. Developed aesthetics and intentional design and typography can go a long way in promoting legibility and quick and clear understanding. - Interactive Reporting and Analysis Tools
Tools such as interactive pdfs or Web GIS can allow clients and stakeholders to access and explore data for themselves. - Animation (4D) and Video
Data-driven animation provides a relatable platform through which complex information can be quickly conveyed to the viewer. These demonstratives can be used in a variety of circumstances: from communicating scientific data to an audience unfamiliar with the issues such as a jury or the public to providing narrative context to professionals working in the field. Ultimately, the strength of these visual aids is their ability to reveal not only the results of data inquiry but also the story within it. - Communication Briefs
Our communication briefs use straightforward language that is designed to be accessible to non-technical audiences, complemented by carefully designed illustrations, to bring clarity to scientific explanations.
Case Study
CHALLENGE
Communicating complex technical concepts such as environmental or remediation systems, hydrogeological, or other environmental engineering challenges to audiences that are unfamiliar with the field.
THE APPROACH
Example 1
In litigation, data from GIS analysis may be displayed using graphics software to make it more visually appealing and easier to understand. Our expert reports rely heavily on graphics to illustrate topics and call-out boxes to explain complex environmental topics in a manner that all stakeholders can understand. Additionally, video shot with a UAV (Unmanned Aerial Vehicle) may be used to provide context to a site for a jury that may not be familiar with the area. As an example, a UAV was used to capture high-definition video in northern Oklahoma to convey just how rural the area is to the jury in Oklahoma City.
Example 2
A publ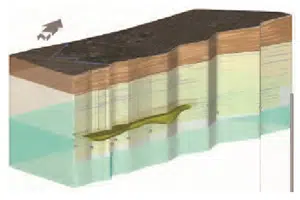 ic meeting wherein the public did not understand how groundwater travels through the soil, carrying contamination underground. They were worried about it traveling under their property. A 3D animation illustrated how the contamination was released into the soil, migrated to groundwater, where the dissolved contamination flowed to, and how it was being remediated.
The NewFields Difference
We don’t just present the data; we tell the story. Visualization and animation bring the narrative to life and distill clear concepts from overwhelming amounts of data.
NewFields has visualization specialists on staff with technical backgrounds that increase our comprehension of the key issues and the best way to illustrate them. We have a wide variety of tools and software at our disposal, so every project can be custom-tailored to a client’s needs, audience and budget. Our experts are interdisciplinary, combining technical, engineering, scientific, and graphic design expertise to create customized, scalable solutions that other companies are not nimble enough to take on.
Let us help you with your next project and experience the NewFields difference!
 Facebook
 Instagram
 LinkedIn
 Twitter
